Timetable Scorestr
The Timetable score on the Schedule card is a simple 3 star system to get a quick understanding of how effective the generated Timetable is in meeting all the constraints with the given resources. Higher stars mean most effective, with 3 being the highest.
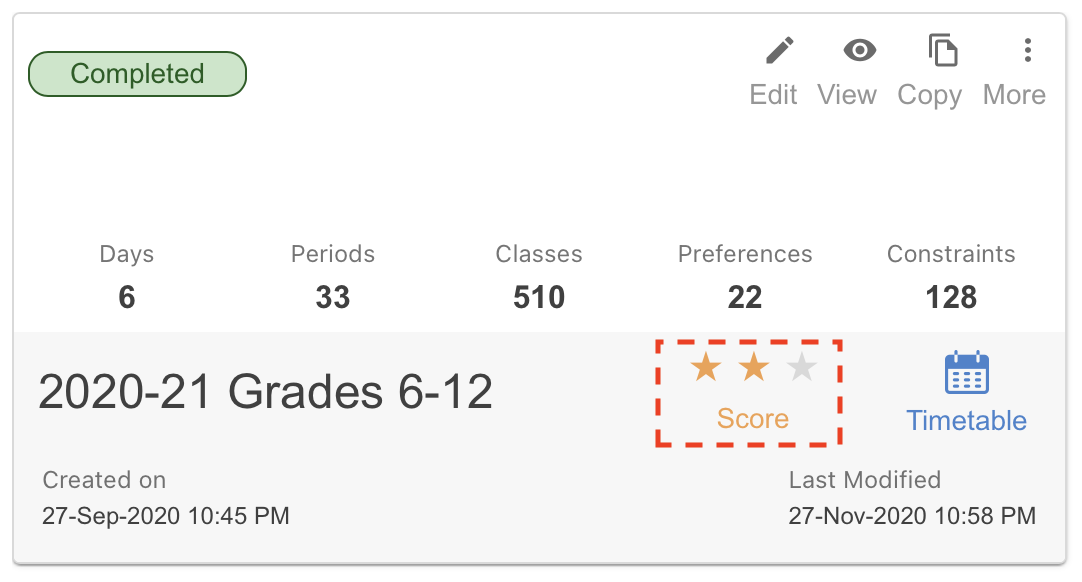
Fig. 47 Timetable score starsstr
Clicking on the score opens up a new window that shows the detailed metrics that measure the Timetable efficacy.
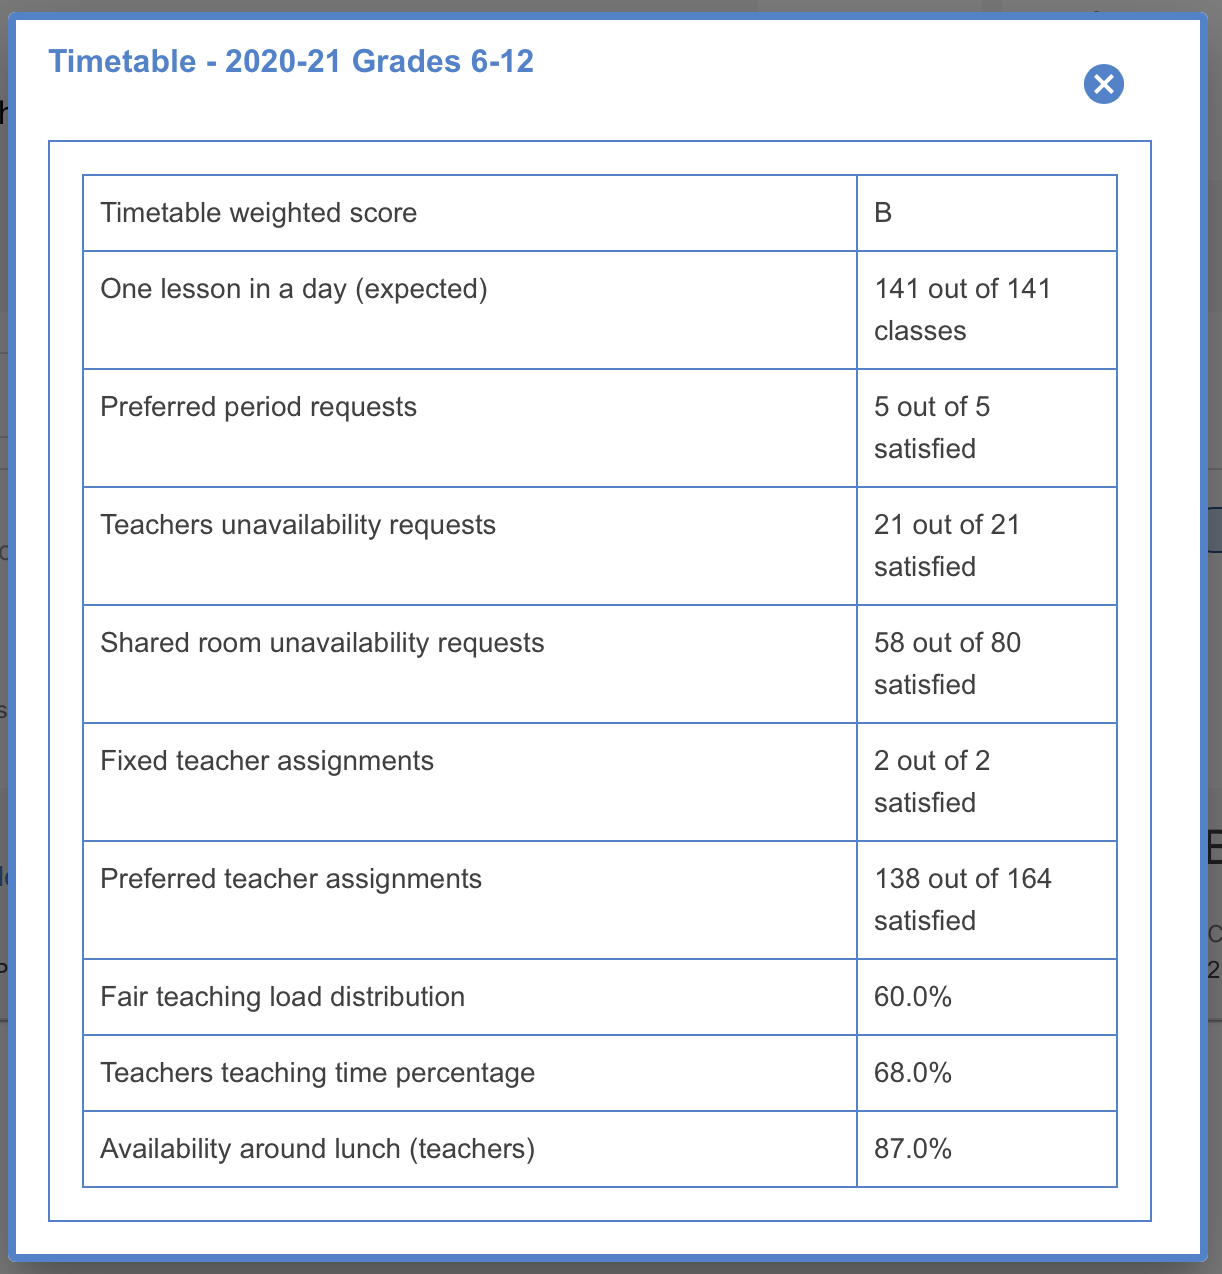
Fig. 48 Timetable score detailsstr
Timetable Score Detailed Metricsstr
The Timetable detiled metrics provides key insight on how the Timetable was able to meet the constraints specified.
Metric |
Description |
|---|---|
Timetable weighted score |
The overall Timetable score is a summarization of the individual metrics presented below. A score of A is the highest while C is lowest. |
One lesson in a day (expected) |
Although not specified explicitly, SchoolPivot algorithm always tries to form a Timetable that supports only one lesson of a Subject to a Group per day. This helps in distributed and uniform lesson schedule. However, sometimes, this cannot be satisfied if the supporting resources are not there. The One lesson in a day metric shows how many lessons meet this criteria. |
Preferred period requests |
The Preferred period requests metric shows how many Preferred Period rules (See Period Rules) were satisfied by the generated Timetable. |
Teachers unavailability requests |
Teacher unavailibility information are specified in the the Teacher’s School Master Data (See Teachers). The SchoolPivot app tries to schedule classes based on all such unavailability request, however, there may be scenarios where such requests cannot be satisfied based on available resources. The Teachers unavailability requests metric shows how many such requests were satisfied by the generated Timetable. |
Shared room unavailability requests |
Similar to Teachers, Shared Rooms also may be unavailable at certain times (See Shared Rooms). The Shared room unavailability requests metric shows how many such requests were satisfied by the generated Timetable. |
Fixed teacher assignments |
The Fixed teacher assignments metric shows how many Fixed Teacher rules (See Teacher Rules) were satisfied by the generated Timetable. |
Preferred teacher assignments |
The Preferred teacher assignments metric shows how many Preferred Teacher rules (See Teacher Rules) were satisfied by the generated Timetable. |
Fair teaching load distribution |
The SchoolPivot algorithm is designed to have all teachers teach the same number of lessons per week. We believe that a uniform load distribution among Teachers helps in higher teaching efficiency for the School. However, that is not always possible given the resource constraints and rules. The Fair teaching load distribution metric indicate the degree to which the teaching load distribution is uniform across all Teachers. Higher percentage is favorable as that indicates closer to uniform distribution. |
Teachers teaching time percentage |
The Teachers teaching time percentage metric indicates how busy Teachers are throughout the week in teaching classes. The percentage displayed is an average across all Teachers in the School. It is always preferable to strike the right balance between teaching and non-teaching time for Teachers. While we want Teachers to be primarily teaching classes, the more free time they have, the more they can use that time for course development. Also, availability of substitute increases if Teachers are not busy teaching throughout the week. |
Availability around lunch (teachers) |
We believe that having a contiguous free time around the lunch hour can help Teachers to be more productive. That is why the SchoolPivot algorithm designs the Timetable to provide Teachers a free period around lunch. However, given the different rules and constraints, that may not be always achievable. This metric provides an understanding of the percent of Teachers who have a free period around lunch. |
Note
SchoolPivot generates the best possible Timetable schedule given the available resources and the specified Rules. However, not all Rules (Fixed or Preferred) may get satisfied because of lack of resources or internal conflicts. In such cases, the Scheduler will show the unsatisfied Rules as Warnings and Errors on the Rules page. Timetable scores are also lower for such Timetables which cannot satisfy all Rules.